Grid rules per the EEC Guideline
| Zone length or width | Loggers per side |
|---|---|
| up to 10 m | at least 2 |
| 10 to 40 m | at least 3 |
| 40 to 60 m | at least 4 |
| 60 m or more | at least 5 |
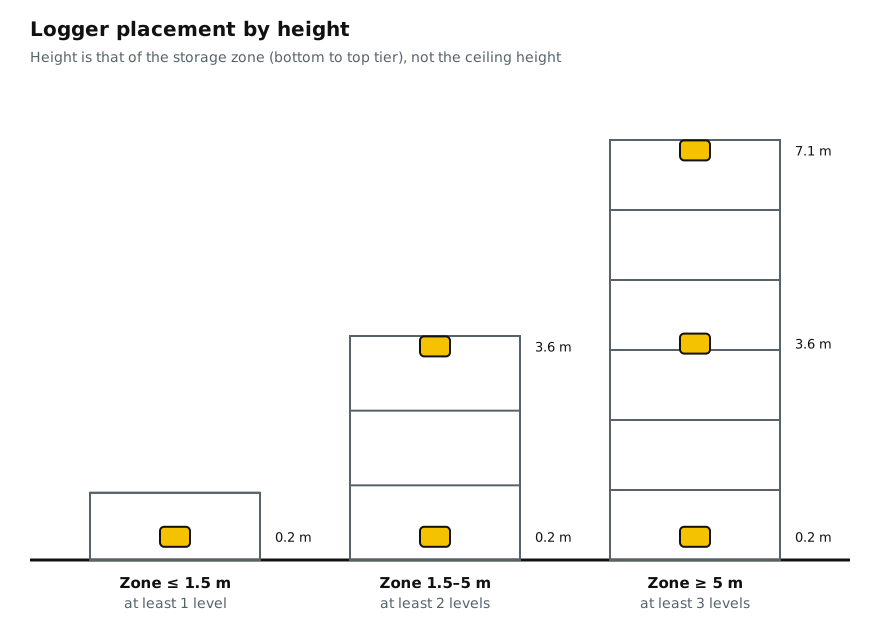
| Storage area height | Vertical levels |
|---|---|
| up to 1.5 m from the floor | at least 1 |
| 1.5 to 5 m | at least 2 |
| 5 m or more | at least 3 |
Loggers are placed in a grid, at equal intervals where possible, so that they cover the storage area along its entire length and width, and always at locations where products are actually or expected to be stored.
Formula and calculator
where nrisk is the number of additional points near gates and doors, under air conditioners and air ducts, near heaters, sun-exposed walls and windows, and in receiving and dispatch areas.
Calculation examples
| Facility | Grid | Risk points | Total |
|---|---|---|---|
| Pharmacy warehouse 9 × 6 m, 2.2 m racks | 2 × 2 × 2 = 8 | door, air conditioner: 2 | 10 |
| Warehouse 30 × 18 m, 4.5 m racks | 3 × 3 × 2 = 18 | gate, 2 air conditioners, window: 4 | 22 |
| Warehouse 45 × 20 m, 6 m racks | 4 × 3 × 3 = 36 | two gates, 2 air conditioners: 4 | 40 |
| Distribution center 72 × 48 m, 10 m racks | 5 × 4 × 3 = 60 | 6 gates, 4 air ducts, skylights: 12 | 72 |
| Cold room 12 × 8 m, 3 m racks | 3 × 2 × 2 = 12 | door, 2 evaporators: 3 | 15 |
It pays to divide large warehouses into zones by purpose and conditions: receiving, main storage, dispatch, quarantine. The EEC Guideline recommends mapping both receiving and dispatch areas, since that is where deviations occur most often.
Where to add extra points
| Risk source | What happens | Where to place loggers |
|---|---|---|
| Gates and doors | warming in summer and cooling in winter when opened | nearest storage locations at the bottom and top levels |
| Air conditioners, air ducts | local overcooling in the airflow | the first racks along the airflow path |
| Heaters | overheating of adjacent racks in winter | nearest storage locations |
| External walls, windows, skylights | solar heating, cold surfaces | by the wall at the top level |
| Top of racks under the roof | stratification, warm air at the top | top level deep inside the warehouse |
| Dead-end areas without circulation | stagnant air, slow response | middle of the dead-end aisle |
How to mount a data logger
- Avoid direct contact between the sensor and metal, concrete or other heat-conducting surfaces: use plastic holders, cable ties with a gap, or suspension.
- Position the device so that it cannot be damaged or moved during loading operations.
- The sensor should be in the air next to the product, not inside a box or pressed against pallet wrap, unless product temperature is the target.
- Label each logger with its point number and photograph the installation location; this makes seasonal studies repeatable.
- Fill in the placement table: logger ID, serial number, number on the layout, installation height, remarks.
Placement table
| ID | Serial number | Number on layout | Height, m | Remarks |
|---|---|---|---|---|
| R-01 | stated if different from ID | A1-b | 0.2 | row A, by gate 1 |
| R-02 | A1-m | 3.0 | row A, by gate 1 | |
| R-03 | A1-t | 5.8 | row A, top level | |
| … | ||||
| R-41 | EXT | 1.5 | outside, by the north wall |
Frequently asked questions
How many data loggers are needed for a 1,000 m² warehouse?
It depends on the shape and height. For example, 40 × 25 m with 6 m racks: 4 × 3 × 3 = 36 grid points plus risk points. A 50 × 20 m rectangle of the same height gives the same 36, and with 4 m racks, 24.
Should height be measured to the ceiling or to the top rack level?
To the top storage level. The bottom point is at the height of the lowest pallet or level, the top point at the height of the top rack level.
Can the number of data loggers be reduced?
The EEC grid is a minimum. Reducing it is not recommended; on the contrary, risk analysis adds points at problem locations.
Is a data logger needed outside the warehouse?
If the storage area borders the external environment, the report states the outside temperature, so an outdoor logger is needed to interpret the results.