What warehouse mapping reveals
The air in a warehouse is never at one uniform temperature. In summer it is hotter by the loading dock doors, warmer under the ceiling than near the floor and colder next to the air conditioner; in winter the picture flips near radiators and poorly insulated walls. A single thermohygrometer on the wall shows the temperature only at its own spot and says nothing about a pallet on the top rack level five meters away.
Mapping replaces guesswork with measurements. For the duration of the study, a grid of electronic data loggers is placed across the storage area, all recording temperature simultaneously at the same interval. After processing, you can see:
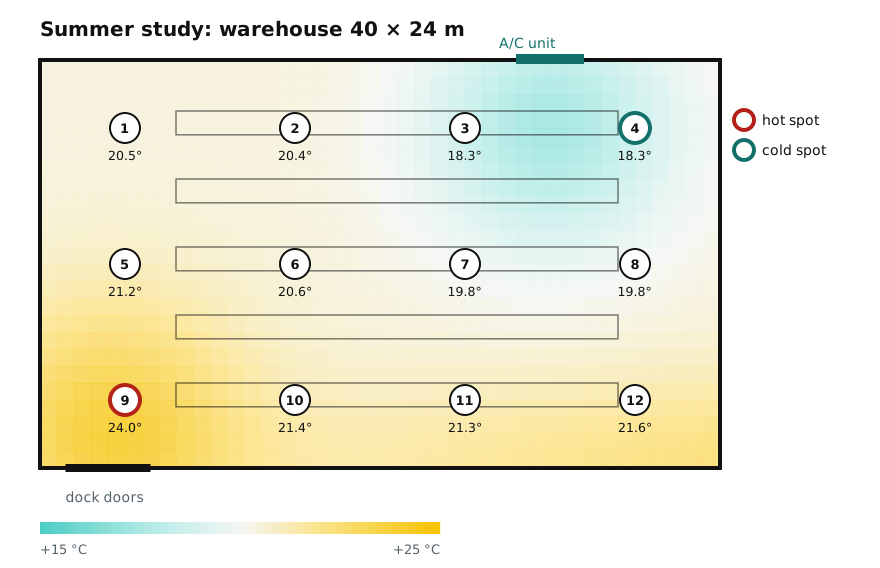
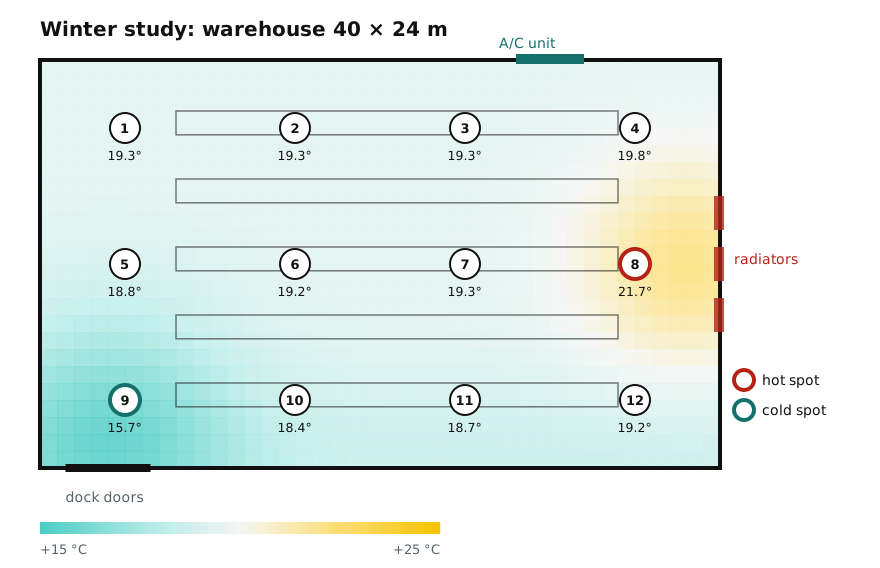
- the cold and hot spots: the locations with the minimum and maximum values recorded within the acceptable range;
- critical spots: the locations with the strongest temperature fluctuations;
- locations where storage is not allowed because excursions occur there repeatedly;
- stable areas suitable for the most sensitive products;
- positions for monitoring sensors that will remain in operation after the study is complete.
Requirements in Russia for 2026
Order No. 646n of the Russian Ministry of Health ceased to be in force on 31 May 2025, and since 1 September 2025 the former Order No. 706n has been replaced by the new Rules for Storage of Medicinal Products approved by Order of the Russian Ministry of Health No. 260n of 29 April 2025. Mapping requirements are now based on the following documents.
| Document | What it requires |
|---|---|
| EAEU Good Distribution Practice Rules (EEC Council Decision No. 80 of 3 November 2016), clause 39 | Initial mapping of storage premises before they are put into use, under conditions representative of operation; repeat mapping based on risk assessment and after changes |
| Rules for Storage of Medicinal Products (Order No. 260n of the Russian Ministry of Health), clause 18 | A wholesale distributor places its temperature and humidity monitoring devices at the points of greatest fluctuation identified by mapping; mapping is repeated based on risk assessment and after changes to the design of the premises or equipment |
| Rules for Storage of Medicinal Products (No. 260n), clause 17 | If the manufacturer has not specified special conditions, storage at +15…+25 °C and relative humidity not exceeding 65% |
| Guideline on Temperature Mapping (EEC Board Recommendation No. 8 of 20 April 2026) | Methodology: protocol, logger selection, grid spacing, duration, data analysis, report content. Applies from 23 May 2026; advisory in nature |
| OFS.1.1.0010 “Storage of Medicinal Products” (State Pharmacopoeia of the Russian Federation) | Definitions of temperature ranges and storage conditions |
For pharmacies, mapping as a study is not explicitly required: every pharmacy must keep a daily temperature and humidity log, but the requirement in Rules No. 260n to position instruments based on mapping results is addressed to wholesale organizations. Even so, pharmacy chains with large warehouses and healthcare facilities carry out mapping voluntarily, as it is the most reliable way to justify where thermohygrometers are installed.
How we carry out mapping
The EEC guideline divides the procedure into four stages: protocol, study, report and corrective actions. Below is how this works in practice for a warehouse.
- Survey and input data
We request the floor plan, dimensions (length × width × height of the storage area), racking layout and the locations of doors, windows, air conditioners, air ducts, heaters and any sensors already installed. We confirm the storage conditions and the warehouse operating schedule.
- Mapping protocol
We describe the facility and the rationale, scope, objectives, acceptance criteria, logger type and verification details, the layout diagram and placement table with unique point numbers, the recording interval, duration and test conditions including door-opening tests. The protocol is approved by the client’s management.
- Logger preparation
We use loggers of a single type: our own Smartag temperature indicators with valid verification. Each one is assigned an ID and programmed with the same recording interval (usually 5–10 minutes) and a synchronized start that allows time for placement. We check that every device is recording data.
- Placement and study
We fix the loggers according to the layout so that forklifts cannot move them and the sensor does not touch metal or concrete. Warehouse staff are informed about the study. One logger is placed outside the area if it borders the outdoors or an unheated room.
- Data collection and analysis
After 7 days or more, we remove the devices and match serial numbers against their positions. For each point we calculate the minimum, maximum and mean, identify the cold, hot and critical spots, and compare the results with the acceptance criteria and with events in the warehouse.
- Report and recommendations
We issue a report with tables, graphs for each logger, heat maps, a conclusion on the suitability of the area, a list of locations excluded from storage and positions for permanent monitoring. Where needed, we add a corrective action plan and a repeat study.
How many loggers are needed
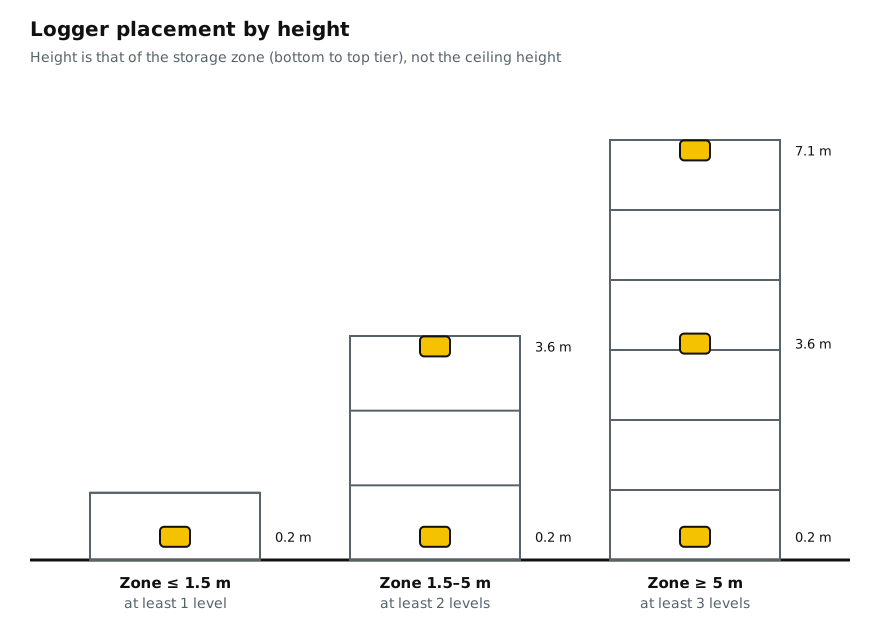
The EEC guideline sets the minimum grid spacing separately for the length, width and height of the storage area. The total number of points is the product of the three factors, plus additional points in risk zones: by doors, under air conditioners and along sun-exposed walls.
| Area dimension | Minimum number of loggers |
|---|---|
| Length or width up to 10 m | at least 2 along that side |
| 10 to 40 m | at least 3 |
| 40 to 60 m | at least 4 |
| 60 m or more | at least 5 |
| Storage height up to 1.5 m | at least 1 level |
| 1.5 to 5 m | at least 2 levels |
| 5 m or more | at least 3 levels |
Example. A 45 × 20 m warehouse with 6 m high racking: 4 points along the length, 3 along the width and 3 levels in height gives 36 grid loggers. Add 4 points in risk zones (by the doors and under two air conditioners) and 1 outdoor logger for a total of 41. You can calculate your own facility with the calculator on the logger placement page.
Duration and seasonality
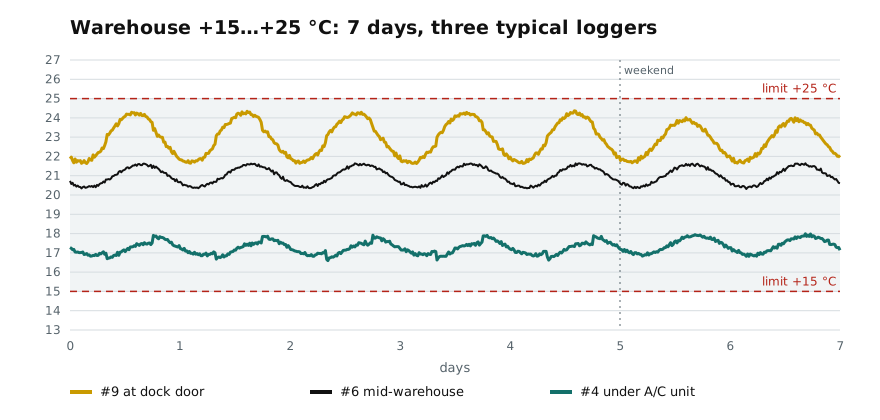
Warehouses and other controlled-environment premises are mapped for at least 7 consecutive days. A full week ensures the data covers working days with door openings as well as nights and weekends, when ventilation and heating may operate differently.
Because a warehouse is affected by the weather, the guideline recommends at least two studies: during the hottest and the coldest periods of the year. For central Russia this usually means July–August and January–February; in southern regions the summer peak matters more, while in Siberia and the Urals it is the winter, when a cold spot below +15 °C can easily appear by the doors and exterior walls.
Empty or loaded warehouse
Mapping of an empty area is performed as part of operational qualification (OQ): it shows what the premises and climate control equipment are capable of on their own. Mapping of a loaded warehouse belongs to performance qualification (PQ): pallets change air flows, and the real hot spots are often deep inside the racking. If the warehouse is already in operation, the guideline allows mapping in the loaded state.
What the report includes
- a description of the storage area and the study participants;
- details of the loggers and their verification (record number or verification mark), the layout diagram and placement table;
- acceptance criteria and the study program, including door-opening tests if performed;
- minimum, maximum and mean values for each point, the cold and hot spots, and the outdoor temperature;
- graphs for each logger and the raw data in electronic form;
- conclusions on the suitability of the area, locations excluded from storage, and proposals for relocating monitoring sensors and for the climate control equipment;
- records of deviations and corrective and preventive action (CAPA) forms.
Common mistakes
- A logger on a metal upright without insulation. The sensor measures the temperature of the metal, not of the air around the product.
- Different logger models. Differences in time constant and accuracy masquerade as “hot spots”.
- Three days instead of a week. The data misses weekends and the operating cycle of the climate control system.
- Points only at eye level. In hot weather, the top rack levels are often 2–4 °C warmer.
- One study for all seasons. A summer study does not reveal the winter problem at the doors, and vice versa.
- A report with no decisions. The results must end in a monitoring layout and a list of locations where storage is not allowed.
Frequently asked questions
Is mapping mandatory for a distributor’s warehouse?
Yes. The EAEU Good Distribution Practice Rules require initial mapping of storage premises before they are put into use, and Storage Rules No. 260n require a wholesale organization to position its temperature monitoring devices based on mapping results and to repeat mapping based on risk assessment and after changes.
How long does warehouse mapping take?
The study itself runs for at least 7 consecutive days. Including protocol preparation, logger placement, removal and the report, the whole project usually takes 3–4 weeks. Two studies are recommended: one in summer and one in winter.
Can mapping be carried out in an operating warehouse?
Yes. The EEC guideline allows mapping of areas that are already loaded. Loggers are fixed so that they do not interfere with operations, and staff are informed about the study.
What recording interval should be used?
The EEC guideline allows an interval of 1 to 15 minutes. For a warehouse, 5–10 minutes is usually sufficient: it is enough to capture door openings, and the logger memory does not fill up within a week.
Do loggers need to be verified for mapping?
Yes. A logger must have valid verification, or calibration where required by law, and the details are stated in the report. The absolute error must not exceed ±0.5 °C.
What are hot and cold spots?
They are the locations with the maximum and minimum temperatures recorded during the study within the acceptable range. Critical spots are the locations with the greatest fluctuations. If values fall outside the limits, that is a deviation, and the location is excluded from storage or requires action.
Does humidity need to be mapped?
If the warehouse stores products that are sensitive to high humidity and not protected by their packaging, relative humidity is monitored alongside temperature. By default, Rules No. 260n limit it to 65%.
When is warehouse re-mapping required?
After a layout change, new racking, replacement or relocation of climate control equipment, deviations without an established cause, and based on risk assessment. For more details, see the page on re-mapping.
How much does warehouse mapping cost?
The cost depends on the floor area and height, the number of zones, the number of loggers and the number of seasons. For an accurate quote, send us the floor plan and the racking height, and we will calculate the grid and the timeline.
What are the penalties for not mapping?
A violation of storage rules by a license holder may be classified as a gross violation of license requirements: under Part 4 of Article 14.1 of the Russian Code of Administrative Offenses, legal entities face a fine of 100,000 to 200,000 RUB or suspension of operations for up to 90 days. The outcome depends on the specific circumstances of the inspection.